Is Music Getting Better or Worse Over Time?
A look into 40 years of Rate Your Music’s top-1000 charts.
September 2, 2020
Is Music Getting Better or Worse Over Time?
A look into 40 years of Rate Your Music’s top-1000 charts.
Published: September 2, 2020, Last updated: January 17, 2021.

At the time of writing, Sonemic, the next version of Rate Your Music, is in it's fifth beta version, and will bring with it a new charting algorithm. This means that the aggregated 'RYM Rating' metric used in this post will not be in line with the new rating system on Sonemic. Further, the data used in this post was collected towards the end of 2019, and so some of the specific numbers mentioned in this post may not be current1.
Using Rate Your Music, this post aims to answer the question: Has the overall quality of music changed over time?
What is Rate Your Music?
Rate Your Music is an online,
collaborative database of music releases in which users can leave
ratings and reviews. Since the site launched in 2000, it has accrued
approximately 600,000 users, and indexes 3.7 and 1.2 million releases
and artists respectively. For those interested in music critique, Rate
Your Music (henceforth, RYM) presents an interesting database with a
breadth of musical perspectives for whatever music you happen to be
interested in2. If you'd like to know how Kendrick
Lamar's To Pimp a Butterfly was received, review aggregators
such as Metacritic and
AnyDecentMusic? can
easily give you what you're looking for. But, if you stumble across
Fishmans' Long Season while trawling /mu/ and want to know what all the fuss is
about, Metacritic and AnyDecentMusic? will return no
results. Fear not though, as on RYM you'll find this album has received
over 13 thousand ratings and over one hundred reviews.
The RYM Rating and Chart Ranking
RYM users can rate albums using the five-star rating system with
half-star increments. These ratings are used to determine the RYM
Rating of an album, a value up to 5 which increments to the
hundredths. Different weights are assigned to user-ratings based on the
user's activity on the site, the diversity of the ratings they give, and
whether or not they take the time to write reviews. Weighting factors of
0.0, 0.5,
1.0, or 1.25
are used, however, the specifics of the weighting algorithm are not
public.
RYM also has charts to rank albums, say, for a given year, decade, or for all-time. Many factors contribute to determining the chart ranking of albums, such as the weighted ratings explained above, the overall popularity of albums, and many other factors. The chart ranking algorithm is also not made public.
Dataset
While there is a lot of data on RYM, unfortunately, RYM provides no API for easily accessing it outside of the browser. While respecting RYM's no-web-scraping policy, I manually downloaded and parsed HTML to yield a dataset of the top 1000 albums of each year from 1979 to 2018. Forty thousand rows of album ranking, album rating, artist, genre, number of ratings, and number of reviews.
Though RYM does not reveal the algorithm used to generate the RYM Rating or Ranking for albums on the site, inspecting the dataset reveals insight into its mechanics. Below is a plot of how the RYM Rating changes with respect to the year an album is released (point colour), the album's rank in the top-1000 albums of its year of release (x-axis), and the number of ratings the album received (point alpha).
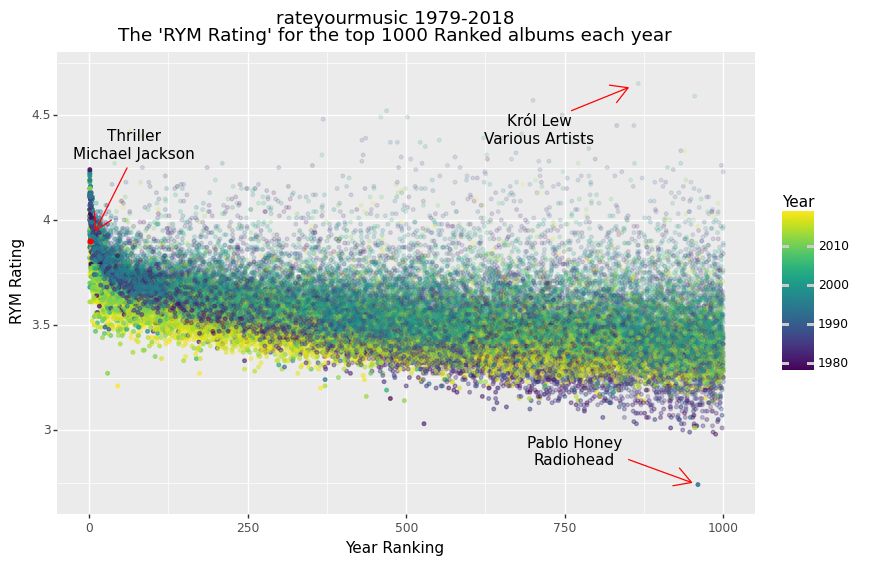
Three points have been highlighted to demonstrate some of the intricacies of this data and its visualisation. Pay particular attention to the 'RYM Rating' and the number of ratings each of these albums received.
Thriller - Michael Jackson
As the best-selling album of all-time, it's no surprise that Michael Jackson's Thriller ranks quite highly on RYM. Second only to The Cure, Michael Jackson's 1982 album received 13,502 ratings and a RYM Rating of 3.90. Given the vast quantity of ratings for this album and the low variance in ratings among highly ranked albums, this is a high-confidence data-point.
Krol Lew - Various Artists
Krol Lew, a Polish release of the Lion King soundtrack3, appears at rank 866 for 1994, receiving a RYM Rating of 4.65, the highest RYM Rating in the dataset, though with only 10 ratings4. Due to the very low number of ratings for this album and its outlier score, this is a low-confidence data-point. Albums which received less than 50 ratings will not be considered in any further analysis in this post.
Pablo Honey - Radiohead
According to RYM, Pablo Honey seems to be the black sheep among Radiohead's studio albums5, with a RYM Rating of 2.74. From the plot, we can see this is by far the lowest score of the forty thousand albums that still ranked in the top-1000 of its year. This can be credited to Radiohead's popularity, both in general and among the RYM community, with the album receiving an incredible 20,534 ratings - this in a dataset where the median number of ratings per album is only 186! A fair conclusion is that Pablo Honey's RYM Rating has high confidence due to the number of reviews. Though, its inclusion in the top-1000 albums of 1993 is dubious and is perhaps an indication that the RYM ranking algorithm weighs popularity too heavily for extremely popular albums.
Analysis
Can this data be used to conclude whether older music is better than modern music? Perhaps. For the sake of analysis, assume as the null hypothesis: The Static Quality Hypothesis - the quality of music does not change over time.
By analysing the data by decade6 some insights emerge. Here, we describe the general characteristics of this data at the decade-scale.
- 2009 - 2018
Starting with the most recent decade first, the falloff of RYM Rating versus Ranking follows an expected trend. This falloff is mostly linear, with the exception of the most-highly ranked albums.
- 1999 - 2008
In this decade, the same trend as above is seen, though this time there is a higher average RYM Rating overall, that is, independent of Ranking.
- 1989 - 1998
This decade is very similar to the one above, though the falloff of RYM Rating with respect to Rating seems to be faster than in the decades above. Furthermore, for lower Rankings, the variance of RYM Rating is greater, and the number of Ratings lower than in the decades above as indicated by the lower alpha of these points.
- 1979 - 1988
Finally, here the steepest falloff in RYM Rating versus Ranking is observed. More so than the decade above, a larger variance in RYM Rating and a lower number of Ratings per album in the tail-end of the Rankings is clear.
From the empirical analysis above, each decade displayed a similar profile, just with variations in the magnitude of the profile and the falloff rate. Naively, let:
\[r = mR + b\]
Where:
- \(r\): RYM Rating
- \(R\): Year Ranking
- \(m\): RYM Rating Falloff, the falloff of RYM Rating per rank in the top-1000
- \(b\): RYM Rating Intercept, the y-intercept of the linear model
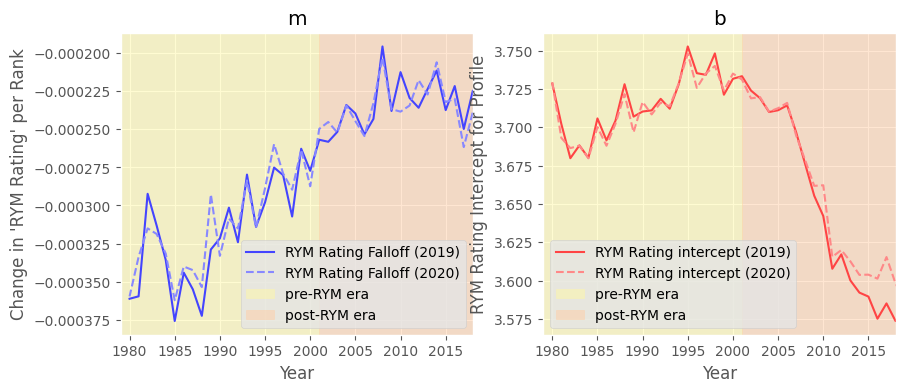
Then, for each year, apply a linear regression to fit the profile to the data7:
This visualisation demonstrates the behaviour of the RYM Rating Falloff and RYM Rating Intercept over time. These features highlight two phases in RYM History. The launch of RYM is one likely explanation for this phase-shift. RYM was introduced in December of 2000, therefore let 1979-2000 be the pre-RYM era, and 2001-2018 be the post-RYM era.

Pre-RYM Era
The RYM Rating Intercept is roughly constant during the pre-RYM era, while the RYM Rating Falloff decreases in magnitude towards the post-RYM era. This indicates that the perception of music for this time did not change significantly, but as the years drew closer to RYM's launch the top-1000 ranking became more competitive.
Post-RYM Era
In the years since RYM's launch, on average the magnitude of the RYM Rating has decreased every year, however, competitiveness for a place in the top-1000 ranking has remained at the peak observed when RYM launched.
Analytical Observations
This analysis yields three significant observations regarding the quality of music released over time. The first two observations are either consistent with the null hypothesis or can be reasonably excused. However, the third observation is not consistent with the null hypothesis and is more difficult to justify.
Observation #1
The profile of the RYM Rating against Ranking is linear each year. This is consistent with the null hypothesis.
Observation #2
The top-1000 Ranking is less competitive for albums released in the pre-RYM era, a trend which is stronger for older albums. This is not consistent with the null hypothesis, however, this observation is reasonably excused by the assumption that older albums are less likely to be remembered by post-RYM era reviewers, and so they are less likely to rank in the top-1000, thus driving down the competition. To compound this, older albums can also be less available via modern streaming platforms.
Observation #3
The post-RYM era has seen a sharp decline in the average RYM Rating given to albums ranking in the top-1000 for each year. That is, the performance of an album released in the post-RYM era seems to be inversely proportional to its age. This is also inconsistent with the null hypothesis, however, unlike Observation #2, this observation is not so easily excused.
A Detailed Look at Observation #3
Indexation Age
Because neither the RYM Rating nor the top-1000 Rankings are static, Observation #3 raises a critical question: What is the behaviour of an album throughout its indexation by RYM? This is not something that is easily revealed from this dataset, as it is a snapshot of RYM at a single point in its history. However, the age of each album indexed by RYM is not the same as its indexation age (the length of time it has been indexed) as an album can only have been indexed after RYM was launched. Assuming that all albums released during the pre-RYM era have the same index age (the same age as RYM), Observation #3 would suggest that an album's RYM Rating increases with its index-age. Because the dataset is a snapshot in time, it is not known if there is a limit to this effect.
Assuming the null hypothesis, it would be desirable to correct for this effect. This idea is explored in Aaron Levine's 2016 analysis of RYM data. Levine hypothesised:
We know which albums from 60's and 70's are classics and rate them appropriately. Albums that were added after RYM went online are fiercely debated and the average rating declines accordingly. This will be supported if average rating declines after RYM launched.
To adjust for differences in variance and mean, Levine corrected the RYM Rating of post-RYM era using \(r_{c}\) as follows:
\[r_c = (r - \bar{r}_{year}) \times \frac{\sigma({r}_{prerym})}{\sigma({r}_{year})} + \bar{r}_{prerym}\]
The issue with this method is that the resulting corrected RYM Ratings are highly sensitive to the characteristics of the dataset of pre-RYM era albums. To make this point, consider three different datasets of pre-RYM era data:
- The top-10 ranked albums for each year of the pre-RYM era
- The top-100 ranked albums …
- The top-1000 ranked albums …
As Fig. 5 demonstrates, the standard deviation of the sample of
top-1000 albums from the pre-RYM era is far greater than the top-10 and
top-100 albums. To demonstrate this further, Fig. 6 attempts to evaluate
the ratio of post- to pre-RYM era albums occupying the
highest n ranks8
throughout all years after correcting post-RYM era
albums to have the same mean and deviation as the pre-RYM era
top-n dataset. If the static hypothesis holds, then Fig. 6 should show
an equal representation of albums from each era throughout the rankings.
Furthermore, if this correction is useful, corrections made using each
data sample should tell the same story.


This analysis shows how erroneous applying a correction factor can be. The poor average of the top-1000 seems to adjust post-RYM era albums too much, while the ratio of pre- to post-RYM era albums is mostly nominal when using the statistical characteristics of the top-10 and top-100 datasets.
Measuring the effect of Indexation Age
In an attempt to measure the influence of indexation age on RYM Rating, I scraped the dataset again, yielding a second view of the same data at another point in time - October 2019, and September 2020 (roughly a year apart). Fig. 7 shows the parameters of the linear model used and tells us that there hasn't been any significant change overall in these parameters, despite the 12-month difference in indexation age9. This time-delta could be too small to measure any change, however, it could also indicate that indexation age is not a significant factor in overall album performance.
Hypothesis Standings
From this point, a justification of Observation #3 will be considered as a supporting argument for the null hypothesis, The Static Quality Hypothesis, while counter-justifications can be considered as evidence for an alternative, The Dynamic Quality Hypothesis.
The Static Quality Hypothesis
Below are some potential justifications for why albums in the post-RYM era seem to be getting worse over time (Observation #3). These justifications would support the null hypothesis:
- RYM users fall into one of two categories: The return-user and the short-lived-user. A respected music critic could be an example of a return-user, while a troll could be an example of a short-lived-user. If return-users leave higher ratings than short-lived-users on average, then this would explain Observation #3, as the reviews of a user who has become inactive contribute less to an albums RYM Rating.
- If the RYM algorithm for determining an albums RYM Rating penalises an album with a high variance in ratings, Observation #3 would be expected as it generally takes time for critical consensus of an album to be reached within the RYM community.
- If older albums tend to have more ratings, perhaps RYM's algorithm for determining an albums RYM Rating penalises albums with fewer ratings irrespective of its age.
The Dynamic Quality Hypothesis
Instead of attempting to excuse the data, perhaps it just indicates that indeed the quality of music is changing over time. Most simply, it could be that the sentiment for an album, and thus its RYM Rating, on average, improves over time. The index-age of an album (how long it has been indexed by RYM), as opposed to an album's actual age, could explain why the average performance of albums in the pre-RYM era is roughly constant over time, or it could be that these albums have only ever been discussed in past tense on RYM, as opposed to new releases which are additionally critiqued upon their release. This is compounded by the very nature of assigning a single number, the RYM Rating, to each album regardless of the era of its release. The RYM performance of an artist's back-catalogue or more widely throughout the genre will be used as a guide to users critiquing new releases.
Conclusion
I have always found the concept of labelling a piece of art with a number fascinating. When done by a single entity, such as an editorial or an influential critic, the number is meaningless without additional context regarding the views, tendencies and biases of the entity. On the other hand, the success of crowdsourced critique is owed to the wisdom of the crowd, whereby the critical assignment reflects the views of the crowd rather than a single entity. However cruel it may be to reduce an artistic piece down to a number, it facilitates analysis like this, which fascinates me further.
Of the hypotheses introduced in this analysis, I do not believe that this dataset alone is enough to disprove the null. Even though the data suggests older albums are 'better', the Static Quality Hypothesis would suggest that they are just perceived more favourably than modern music. Upon release, older music could have exhibited similar critical characteristics to that modern music. The extent to which these perceptions can be used as a proxy for the inherent quality of an album is not clear.
I first began working on this project in October of 2019 out of curiosity, trying to uncover and understand what implications lie in this dataset and being unsatisfied with the outcome described above. However, as I conclude this project, I have reached a satisfaction I had not initially anticipated - the perceptions of music now, today, are what really matters. After its release in 1996, Fishmans' Long Season certainly didn't have the cult-like adoration that it receives today. To this end, the picture painted by RYM is clear-as-day: The perception of an album generally appreciates over time.
Edit: January 17, 2021: If you would like to play with the data yourself, here you can find a jupyter notebook that parses the HTML and generates the plots in this blog post.
Apparently, charts are updated approximately every Tuesday.↩︎
Seriously. Were you aware of the genre 'Bubblegum Bass'?↩︎
On RYM, geography-specific releases are generally bundled under a single title, though not always.↩︎
At the time of writing, the actual RYM Rating of this album is 4.64, 0.01 lower than the data was catalogued. This is an example of the weighting of user-submitted ratings. In this case, the weighting of one or more of the user-submitted ratings has decreased, likely because of inactivity with the user's account.↩︎
Personally, I tend to agree with this outcome.↩︎
You'll have to live with the fact that I'm defining the decade to begin in the year
xxx9and end in the yearxxx8.↩︎Regressing over the entire top-1000 albums for each year hides the slight uptick in RYM Rating observed in the top-ranked albums of each year. However, the trends exhibited by regression over the top-1000, -100, and -10 are identical. Regressing over the top-1000 is used as it is less noisy.↩︎
Here, rank is determined only by the corrected score and is not analogous to the Year Ranking column used so far in this post.↩︎
I made the same observations when repeating this experiment but with only the top-100 and -10 albums of each year, as opposed to the top-1000 as displayed in Fig. 7.↩︎